| 0 | 1 | 2 | 3 | 4 | 5 | 6 | 7 | 8 | |
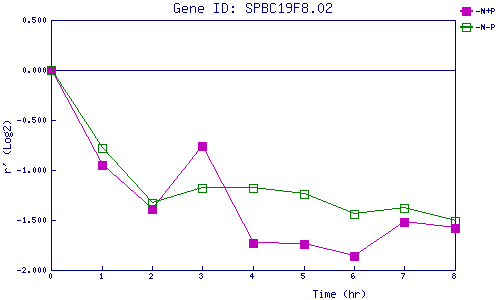
| -N+P | 0.000 | -0.946 | -1.389 | -0.760 | -1.729 | -1.736 | -1.858 | -1.518 | -1.586 |
| -N-P | 0.000 | -0.778 | -1.333 | -1.184 | -1.184 | -1.243 | -1.439 | -1.380 | -1.512 |
|
-N+P: Nitrogen starved in the presence of P-factor -N-P: Nitrogen starved in the absence of P-factor |