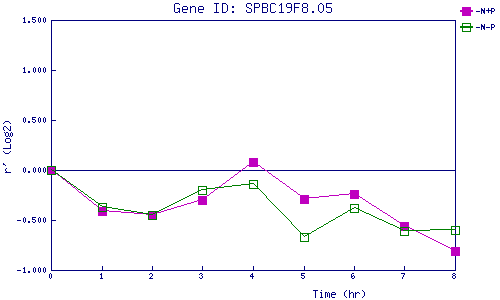
| 0 | 1 | 2 | 3 | 4 | 5 | 6 | 7 | 8 | |
| -N+P | 0.000 | -0.411 | -0.451 | -0.295 | 0.081 | -0.288 | -0.236 | -0.560 | -0.808 |
| -N-P | 0.000 | -0.372 | -0.448 | -0.198 | -0.144 | -0.671 | -0.383 | -0.611 | -0.597 |
|
-N+P: Nitrogen starved in the presence of P-factor -N-P: Nitrogen starved in the absence of P-factor |