crk1 mop1 mcs6
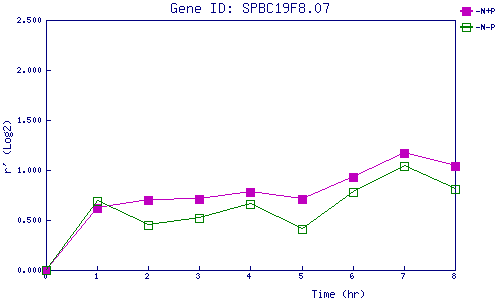
| 0 | 1 | 2 | 3 | 4 | 5 | 6 | 7 | 8 | |
| -N+P | 0.000 | 0.618 | 0.705 | 0.712 | 0.782 | 0.712 | 0.934 | 1.171 | 1.041 |
| -N-P | 0.000 | 0.686 | 0.452 | 0.520 | 0.655 | 0.407 | 0.781 | 1.037 | 0.809 |
|
-N+P: Nitrogen starved in the presence of P-factor -N-P: Nitrogen starved in the absence of P-factor |