msh2
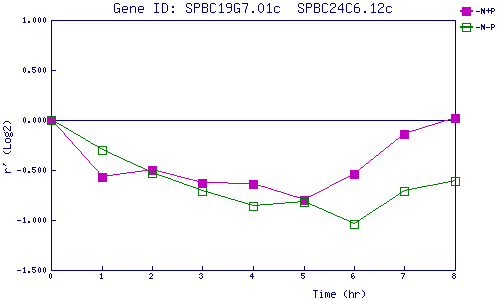
| 0 | 1 | 2 | 3 | 4 | 5 | 6 | 7 | 8 | |
| -N+P | 0.000 | -0.568 | -0.500 | -0.626 | -0.637 | -0.805 | -0.539 | -0.145 | 0.018 |
| -N-P | 0.000 | -0.297 | -0.527 | -0.709 | -0.860 | -0.819 | -1.041 | -0.706 | -0.610 |
|
-N+P: Nitrogen starved in the presence of P-factor -N-P: Nitrogen starved in the absence of P-factor |