| 0 | 1 | 2 | 3 | 4 | 5 | 6 | 7 | 8 | |
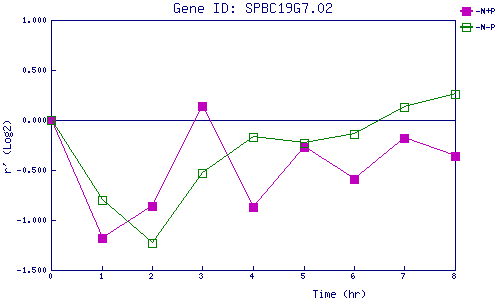
| -N+P | 0.000 | -1.179 | -0.862 | 0.141 | -0.873 | -0.270 | -0.588 | -0.184 | -0.357 |
| -N-P | 0.000 | -0.800 | -1.233 | -0.528 | -0.166 | -0.233 | -0.143 | 0.128 | 0.262 |
|
-N+P: Nitrogen starved in the presence of P-factor -N-P: Nitrogen starved in the absence of P-factor |