rps30-2 ysprs30 rps3002 rps30
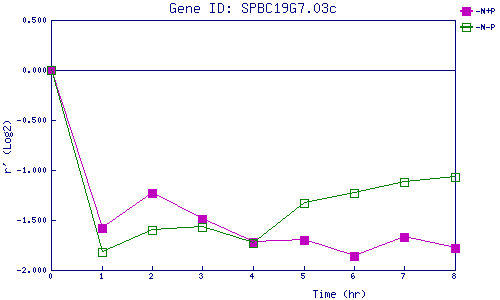
| 0 | 1 | 2 | 3 | 4 | 5 | 6 | 7 | 8 | |
| -N+P | 0.000 | -1.575 | -1.234 | -1.493 | -1.718 | -1.702 | -1.860 | -1.666 | -1.782 |
| -N-P | 0.000 | -1.820 | -1.598 | -1.568 | -1.729 | -1.326 | -1.230 | -1.116 | -1.070 |
|
-N+P: Nitrogen starved in the presence of P-factor -N-P: Nitrogen starved in the absence of P-factor |