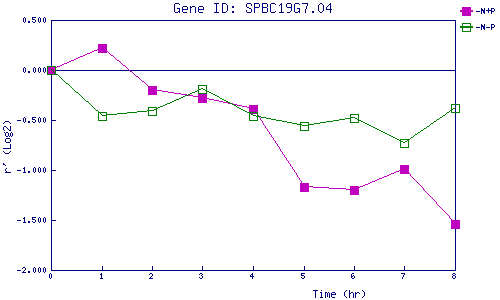
| 0 | 1 | 2 | 3 | 4 | 5 | 6 | 7 | 8 | |
| -N+P | 0.000 | 0.224 | -0.201 | -0.278 | -0.394 | -1.168 | -1.200 | -0.988 | -1.540 |
| -N-P | 0.000 | -0.457 | -0.413 | -0.194 | -0.461 | -0.561 | -0.482 | -0.728 | -0.376 |
|
-N+P: Nitrogen starved in the presence of P-factor -N-P: Nitrogen starved in the absence of P-factor |