cps1 drc1 bgs1
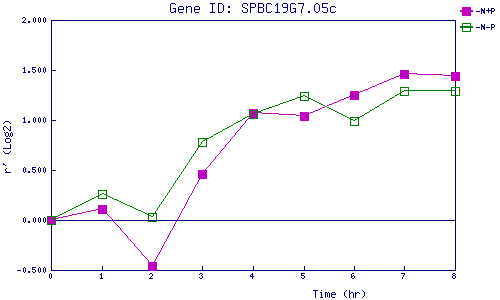
| 0 | 1 | 2 | 3 | 4 | 5 | 6 | 7 | 8 | |
| -N+P | 0.000 | 0.110 | -0.462 | 0.462 | 1.070 | 1.040 | 1.253 | 1.461 | 1.441 |
| -N-P | 0.000 | 0.258 | 0.028 | 0.780 | 1.055 | 1.242 | 0.991 | 1.288 | 1.287 |
|
-N+P: Nitrogen starved in the presence of P-factor -N-P: Nitrogen starved in the absence of P-factor |