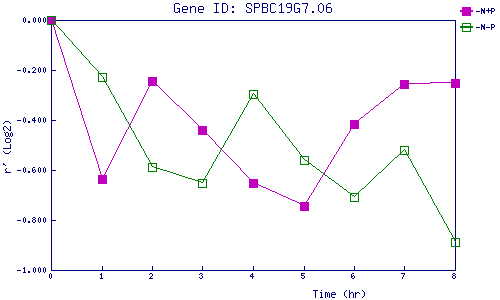
| 0 | 1 | 2 | 3 | 4 | 5 | 6 | 7 | 8 | |
| -N+P | 0.000 | -0.637 | -0.245 | -0.439 | -0.652 | -0.746 | -0.414 | -0.256 | -0.251 |
| -N-P | 0.000 | -0.229 | -0.587 | -0.653 | -0.298 | -0.561 | -0.707 | -0.519 | -0.889 |
|
-N+P: Nitrogen starved in the presence of P-factor -N-P: Nitrogen starved in the absence of P-factor |