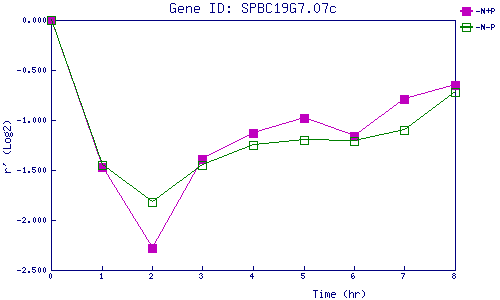
| 0 | 1 | 2 | 3 | 4 | 5 | 6 | 7 | 8 | |
| -N+P | 0.000 | -1.474 | -2.280 | -1.391 | -1.130 | -0.982 | -1.155 | -0.793 | -0.653 |
| -N-P | 0.000 | -1.446 | -1.819 | -1.447 | -1.247 | -1.203 | -1.214 | -1.098 | -0.725 |
|
-N+P: Nitrogen starved in the presence of P-factor -N-P: Nitrogen starved in the absence of P-factor |