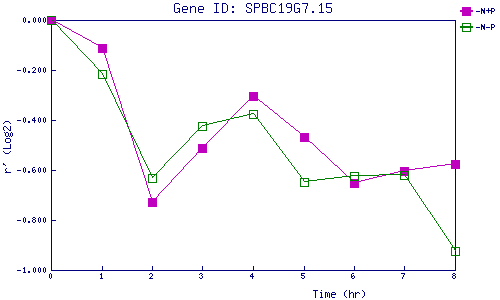
| 0 | 1 | 2 | 3 | 4 | 5 | 6 | 7 | 8 | |
| -N+P | 0.000 | -0.112 | -0.726 | -0.511 | -0.303 | -0.467 | -0.651 | -0.603 | -0.577 |
| -N-P | 0.000 | -0.217 | -0.634 | -0.425 | -0.374 | -0.646 | -0.622 | -0.619 | -0.924 |
|
-N+P: Nitrogen starved in the presence of P-factor -N-P: Nitrogen starved in the absence of P-factor |