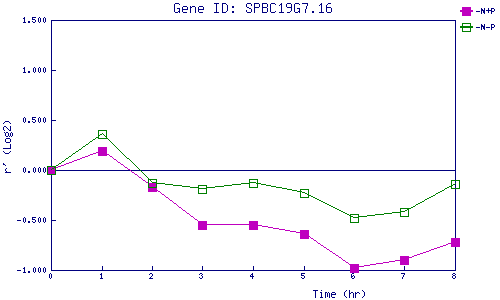
| 0 | 1 | 2 | 3 | 4 | 5 | 6 | 7 | 8 | |
| -N+P | 0.000 | 0.191 | -0.172 | -0.548 | -0.551 | -0.641 | -0.980 | -0.905 | -0.724 |
| -N-P | 0.000 | 0.358 | -0.129 | -0.186 | -0.130 | -0.227 | -0.479 | -0.419 | -0.135 |
|
-N+P: Nitrogen starved in the presence of P-factor -N-P: Nitrogen starved in the absence of P-factor |