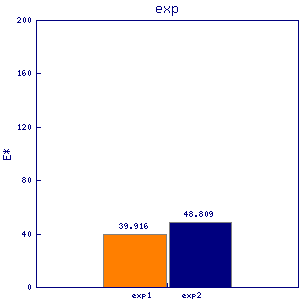
leu1
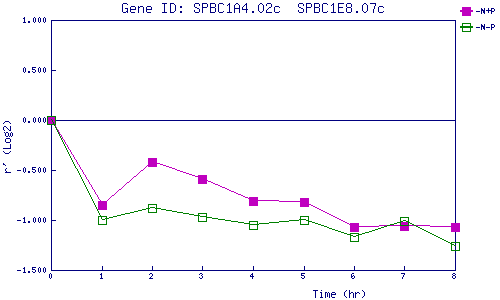
| 0 | 1 | 2 | 3 | 4 | 5 | 6 | 7 | 8 | |
| -N+P | 0.000 | -0.852 | -0.420 | -0.593 | -0.811 | -0.825 | -1.073 | -1.056 | -1.072 |
| -N-P | 0.000 | -0.997 | -0.882 | -0.974 | -1.047 | -1.002 | -1.169 | -1.012 | -1.263 |
|
-N+P: Nitrogen starved in the presence of P-factor -N-P: Nitrogen starved in the absence of P-factor |