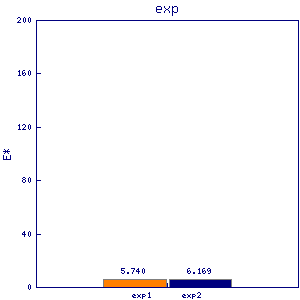
top2
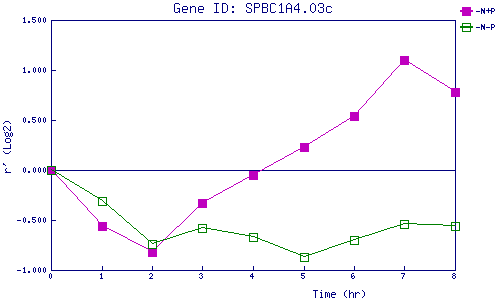
| 0 | 1 | 2 | 3 | 4 | 5 | 6 | 7 | 8 | |
| -N+P | 0.000 | -0.563 | -0.817 | -0.328 | -0.046 | 0.233 | 0.539 | 1.096 | 0.775 |
| -N-P | 0.000 | -0.309 | -0.737 | -0.582 | -0.667 | -0.868 | -0.702 | -0.537 | -0.563 |
|
-N+P: Nitrogen starved in the presence of P-factor -N-P: Nitrogen starved in the absence of P-factor |