| 0 | 1 | 2 | 3 | 4 | 5 | 6 | 7 | 8 | |
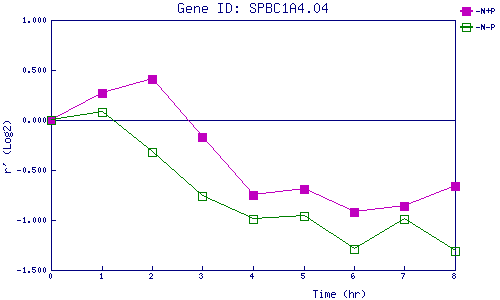
| -N+P | 0.000 | 0.272 | 0.410 | -0.168 | -0.752 | -0.692 | -0.920 | -0.858 | -0.665 |
| -N-P | 0.000 | 0.083 | -0.319 | -0.763 | -0.988 | -0.964 | -1.286 | -0.986 | -1.307 |
|
-N+P: Nitrogen starved in the presence of P-factor -N-P: Nitrogen starved in the absence of P-factor |