| 0 | 1 | 2 | 3 | 4 | 5 | 6 | 7 | 8 | |
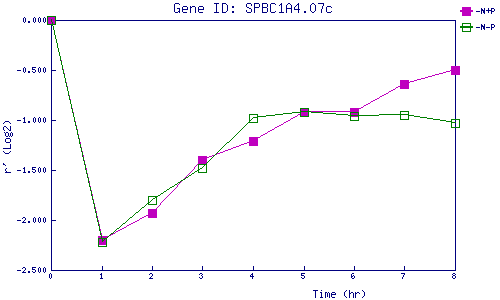
| -N+P | 0.000 | -2.195 | -1.934 | -1.404 | -1.208 | -0.916 | -0.923 | -0.640 | -0.497 |
| -N-P | 0.000 | -2.224 | -1.798 | -1.484 | -0.977 | -0.923 | -0.957 | -0.951 | -1.029 |
|
-N+P: Nitrogen starved in the presence of P-factor -N-P: Nitrogen starved in the absence of P-factor |
