cct3
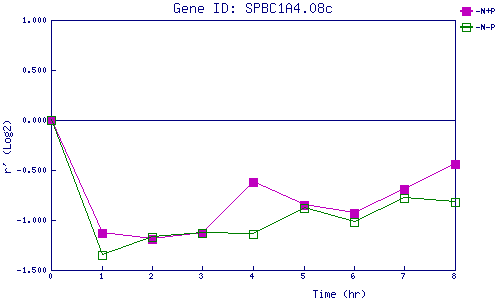
| 0 | 1 | 2 | 3 | 4 | 5 | 6 | 7 | 8 | |
| -N+P | 0.000 | -1.133 | -1.187 | -1.134 | -0.623 | -0.851 | -0.931 | -0.687 | -0.442 |
| -N-P | 0.000 | -1.352 | -1.167 | -1.131 | -1.142 | -0.885 | -1.022 | -0.779 | -0.816 |
|
-N+P: Nitrogen starved in the presence of P-factor -N-P: Nitrogen starved in the absence of P-factor |