| 0 | 1 | 2 | 3 | 4 | 5 | 6 | 7 | 8 | |
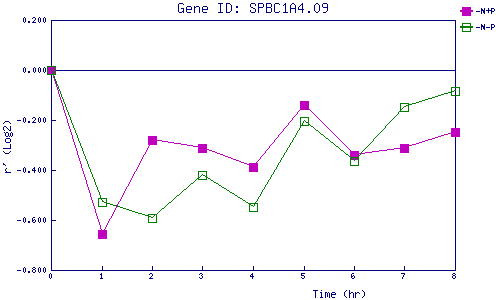
| -N+P | 0.000 | -0.656 | -0.281 | -0.310 | -0.387 | -0.140 | -0.339 | -0.314 | -0.247 |
| -N-P | 0.000 | -0.527 | -0.593 | -0.420 | -0.549 | -0.203 | -0.364 | -0.148 | -0.083 |
|
-N+P: Nitrogen starved in the presence of P-factor -N-P: Nitrogen starved in the absence of P-factor |