| 0 | 1 | 2 | 3 | 4 | 5 | 6 | 7 | 8 | |
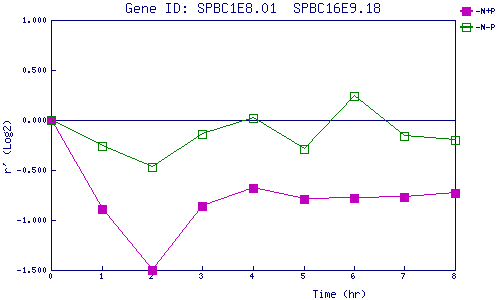
| -N+P | 0.000 | -0.894 | -1.496 | -0.864 | -0.685 | -0.787 | -0.780 | -0.770 | -0.734 |
| -N-P | 0.000 | -0.257 | -0.470 | -0.144 | 0.023 | -0.291 | 0.243 | -0.157 | -0.196 |
|
-N+P: Nitrogen starved in the presence of P-factor -N-P: Nitrogen starved in the absence of P-factor |