Tf2-10-pseudo
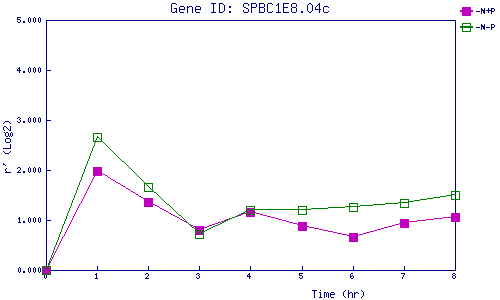
| 0 | 1 | 2 | 3 | 4 | 5 | 6 | 7 | 8 | |
| -N+P | 0.000 | 1.987 | 1.358 | 0.791 | 1.161 | 0.876 | 0.664 | 0.949 | 1.063 |
| -N-P | 0.000 | 2.667 | 1.658 | 0.715 | 1.200 | 1.203 | 1.256 | 1.334 | 1.492 |
|
-N+P: Nitrogen starved in the presence of P-factor -N-P: Nitrogen starved in the absence of P-factor |