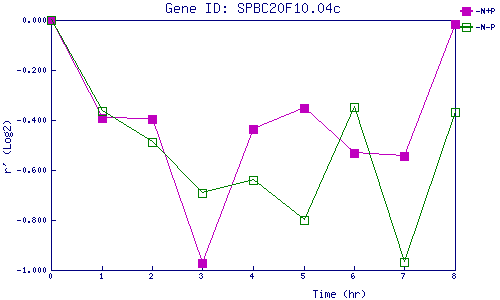
| 0 | 1 | 2 | 3 | 4 | 5 | 6 | 7 | 8 | |
| -N+P | 0.000 | -0.391 | -0.397 | -0.972 | -0.435 | -0.353 | -0.532 | -0.544 | -0.015 |
| -N-P | 0.000 | -0.365 | -0.486 | -0.693 | -0.638 | -0.800 | -0.349 | -0.970 | -0.369 |
|
-N+P: Nitrogen starved in the presence of P-factor -N-P: Nitrogen starved in the absence of P-factor |