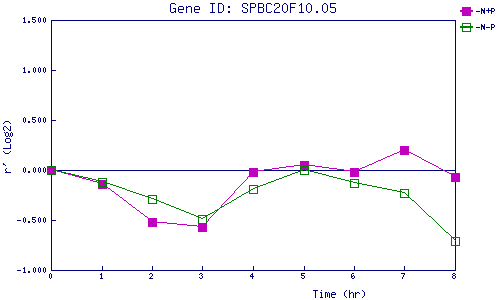
| 0 | 1 | 2 | 3 | 4 | 5 | 6 | 7 | 8 | |
| -N+P | 0.000 | -0.135 | -0.522 | -0.567 | -0.024 | 0.054 | -0.022 | 0.202 | -0.073 |
| -N-P | 0.000 | -0.117 | -0.287 | -0.489 | -0.190 | -0.003 | -0.129 | -0.234 | -0.709 |
|
-N+P: Nitrogen starved in the presence of P-factor -N-P: Nitrogen starved in the absence of P-factor |