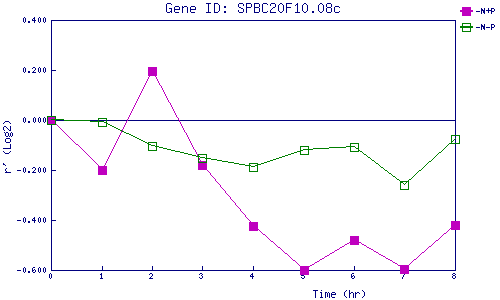
| 0 | 1 | 2 | 3 | 4 | 5 | 6 | 7 | 8 | |
| -N+P | 0.000 | -0.199 | 0.197 | -0.180 | -0.426 | -0.598 | -0.480 | -0.596 | -0.421 |
| -N-P | 0.000 | -0.008 | -0.104 | -0.150 | -0.189 | -0.121 | -0.107 | -0.261 | -0.076 |
|
-N+P: Nitrogen starved in the presence of P-factor -N-P: Nitrogen starved in the absence of P-factor |