lsm5
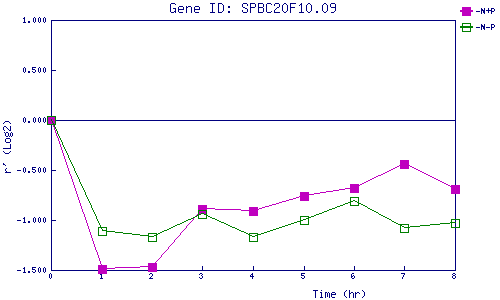
| 0 | 1 | 2 | 3 | 4 | 5 | 6 | 7 | 8 | |
| -N+P | 0.000 | -1.493 | -1.471 | -0.893 | -0.914 | -0.757 | -0.675 | -0.443 | -0.686 |
| -N-P | 0.000 | -1.109 | -1.168 | -0.945 | -1.166 | -1.001 | -0.808 | -1.081 | -1.029 |
|
-N+P: Nitrogen starved in the presence of P-factor -N-P: Nitrogen starved in the absence of P-factor |