| 0 | 1 | 2 | 3 | 4 | 5 | 6 | 7 | 8 | |
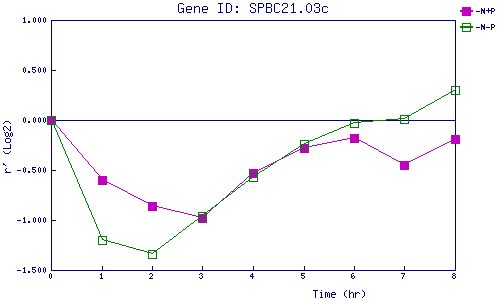
| -N+P | 0.000 | -0.597 | -0.860 | -0.979 | -0.526 | -0.282 | -0.176 | -0.448 | -0.190 |
| -N-P | 0.000 | -1.203 | -1.335 | -0.955 | -0.574 | -0.236 | -0.029 | 0.008 | 0.299 |
|
-N+P: Nitrogen starved in the presence of P-factor -N-P: Nitrogen starved in the absence of P-factor |