sep15 med8
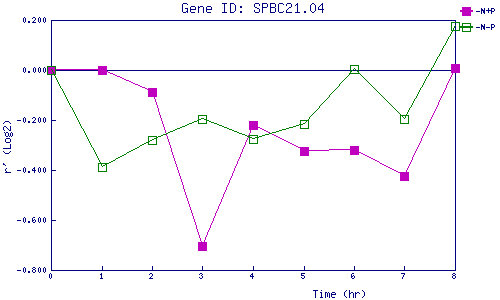
| 0 | 1 | 2 | 3 | 4 | 5 | 6 | 7 | 8 | |
| -N+P | 0.000 | 0.000 | -0.086 | -0.703 | -0.219 | -0.325 | -0.318 | -0.426 | 0.010 |
| -N-P | 0.000 | -0.389 | -0.282 | -0.196 | -0.275 | -0.215 | 0.005 | -0.195 | 0.174 |
|
-N+P: Nitrogen starved in the presence of P-factor -N-P: Nitrogen starved in the absence of P-factor |