cwf3 syf1
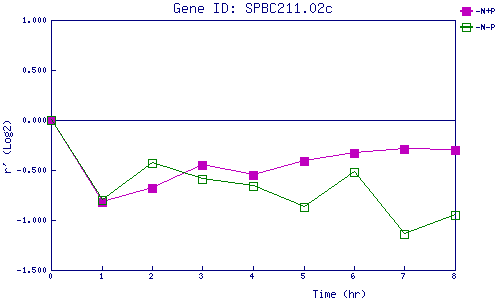
| 0 | 1 | 2 | 3 | 4 | 5 | 6 | 7 | 8 | |
| -N+P | 0.000 | -0.819 | -0.681 | -0.448 | -0.551 | -0.411 | -0.327 | -0.292 | -0.295 |
| -N-P | 0.000 | -0.802 | -0.430 | -0.594 | -0.655 | -0.868 | -0.516 | -1.139 | -0.951 |
|
-N+P: Nitrogen starved in the presence of P-factor -N-P: Nitrogen starved in the absence of P-factor |