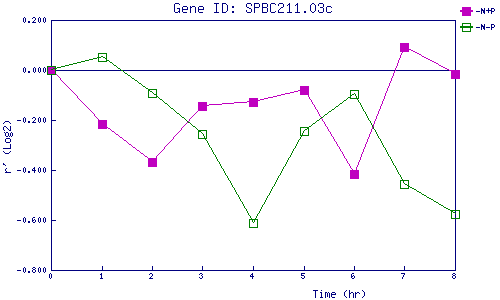
| 0 | 1 | 2 | 3 | 4 | 5 | 6 | 7 | 8 | |
| -N+P | 0.000 | -0.214 | -0.370 | -0.142 | -0.127 | -0.081 | -0.416 | 0.092 | -0.018 |
| -N-P | 0.000 | 0.052 | -0.092 | -0.257 | -0.613 | -0.244 | -0.094 | -0.458 | -0.577 |
|
-N+P: Nitrogen starved in the presence of P-factor -N-P: Nitrogen starved in the absence of P-factor |