mis5 mcm6
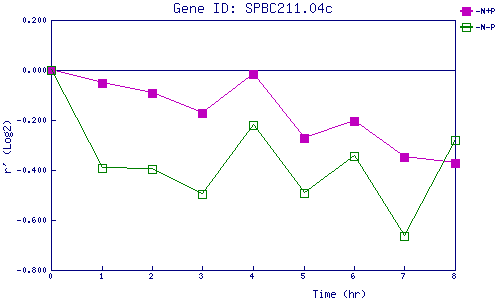
| 0 | 1 | 2 | 3 | 4 | 5 | 6 | 7 | 8 | |
| -N+P | 0.000 | -0.053 | -0.091 | -0.171 | -0.018 | -0.271 | -0.204 | -0.349 | -0.371 |
| -N-P | 0.000 | -0.394 | -0.395 | -0.495 | -0.221 | -0.491 | -0.343 | -0.662 | -0.280 |
|
-N+P: Nitrogen starved in the presence of P-factor -N-P: Nitrogen starved in the absence of P-factor |