| 0 | 1 | 2 | 3 | 4 | 5 | 6 | 7 | 8 | |
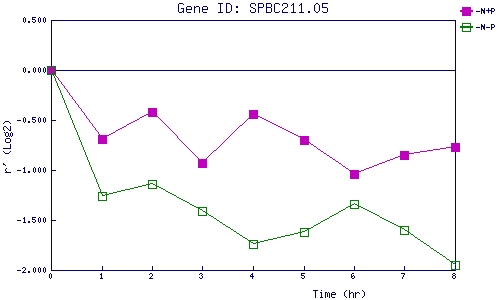
| -N+P | 0.000 | -0.688 | -0.422 | -0.932 | -0.441 | -0.704 | -1.045 | -0.849 | -0.772 |
| -N-P | 0.000 | -1.256 | -1.141 | -1.407 | -1.745 | -1.621 | -1.337 | -1.597 | -1.948 |
|
-N+P: Nitrogen starved in the presence of P-factor -N-P: Nitrogen starved in the absence of P-factor |