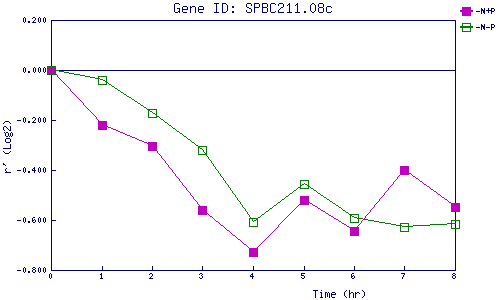
| 0 | 1 | 2 | 3 | 4 | 5 | 6 | 7 | 8 | |
| -N+P | 0.000 | -0.220 | -0.303 | -0.558 | -0.729 | -0.520 | -0.645 | -0.402 | -0.547 |
| -N-P | 0.000 | -0.041 | -0.172 | -0.321 | -0.607 | -0.457 | -0.590 | -0.629 | -0.615 |
|
-N+P: Nitrogen starved in the presence of P-factor -N-P: Nitrogen starved in the absence of P-factor |