bob1
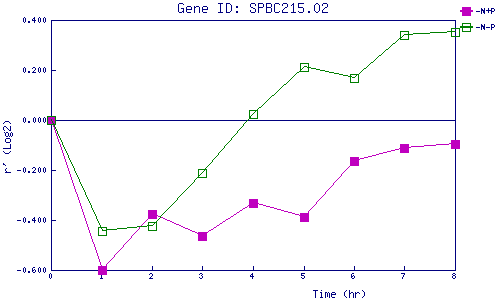
| 0 | 1 | 2 | 3 | 4 | 5 | 6 | 7 | 8 | |
| -N+P | 0.000 | -0.598 | -0.375 | -0.466 | -0.333 | -0.389 | -0.163 | -0.113 | -0.097 |
| -N-P | 0.000 | -0.443 | -0.425 | -0.213 | 0.024 | 0.213 | 0.168 | 0.339 | 0.354 |
|
-N+P: Nitrogen starved in the presence of P-factor -N-P: Nitrogen starved in the absence of P-factor |