git11
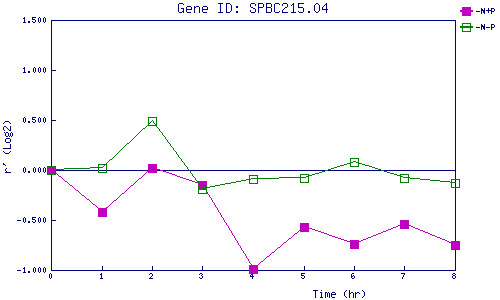
| 0 | 1 | 2 | 3 | 4 | 5 | 6 | 7 | 8 | |
| -N+P | 0.000 | -0.424 | 0.017 | -0.149 | -0.993 | -0.569 | -0.743 | -0.543 | -0.753 |
| -N-P | 0.000 | 0.019 | 0.489 | -0.188 | -0.086 | -0.085 | 0.085 | -0.075 | -0.131 |
|
-N+P: Nitrogen starved in the presence of P-factor -N-P: Nitrogen starved in the absence of P-factor |