| 0 | 1 | 2 | 3 | 4 | 5 | 6 | 7 | 8 | |
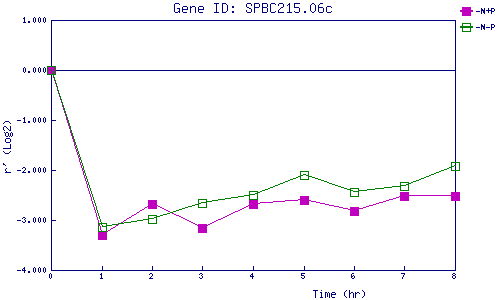
| -N+P | 0.000 | -3.297 | -2.676 | -3.157 | -2.678 | -2.592 | -2.817 | -2.522 | -2.525 |
| -N-P | 0.000 | -3.141 | -2.985 | -2.668 | -2.503 | -2.103 | -2.447 | -2.327 | -1.928 |
|
-N+P: Nitrogen starved in the presence of P-factor -N-P: Nitrogen starved in the absence of P-factor |