cwf10 spef2 snu114
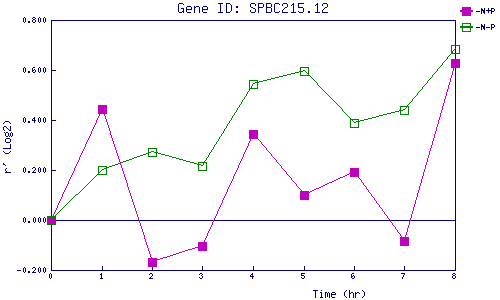
| 0 | 1 | 2 | 3 | 4 | 5 | 6 | 7 | 8 | |
| -N+P | 0.000 | 0.444 | -0.168 | -0.104 | 0.344 | 0.099 | 0.193 | -0.083 | 0.627 |
| -N-P | 0.000 | 0.201 | 0.273 | 0.218 | 0.543 | 0.597 | 0.389 | 0.442 | 0.683 |
|
-N+P: Nitrogen starved in the presence of P-factor -N-P: Nitrogen starved in the absence of P-factor |