nrf1
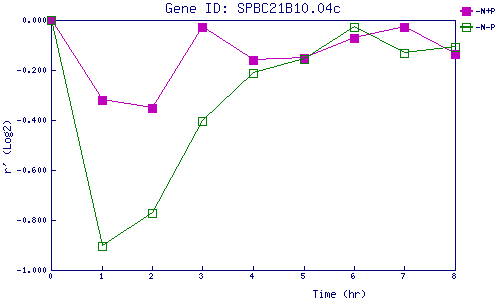
| 0 | 1 | 2 | 3 | 4 | 5 | 6 | 7 | 8 | |
| -N+P | 0.000 | -0.322 | -0.352 | -0.027 | -0.158 | -0.152 | -0.074 | -0.028 | -0.134 |
| -N-P | 0.000 | -0.904 | -0.771 | -0.403 | -0.211 | -0.157 | -0.029 | -0.133 | -0.109 |
|
-N+P: Nitrogen starved in the presence of P-factor -N-P: Nitrogen starved in the absence of P-factor |