pop3 wat1
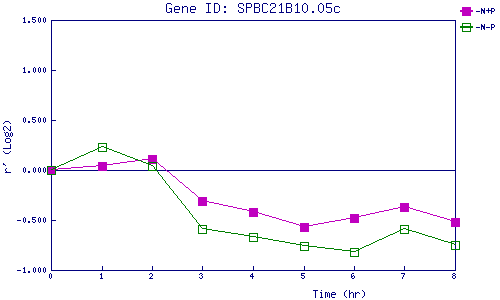
| 0 | 1 | 2 | 3 | 4 | 5 | 6 | 7 | 8 | |
| -N+P | 0.000 | 0.043 | 0.106 | -0.314 | -0.422 | -0.569 | -0.485 | -0.368 | -0.520 |
| -N-P | 0.000 | 0.230 | 0.043 | -0.586 | -0.674 | -0.762 | -0.818 | -0.590 | -0.746 |
|
-N+P: Nitrogen starved in the presence of P-factor -N-P: Nitrogen starved in the absence of P-factor |