rps4-2 rps402
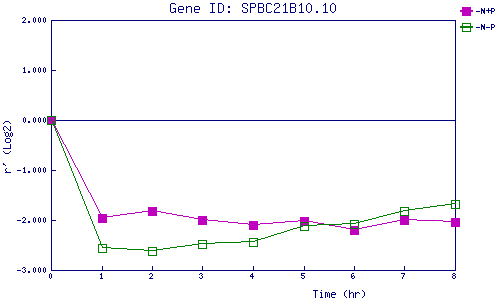
| 0 | 1 | 2 | 3 | 4 | 5 | 6 | 7 | 8 | |
| -N+P | 0.000 | -1.962 | -1.826 | -1.992 | -2.098 | -2.011 | -2.191 | -1.998 | -2.042 |
| -N-P | 0.000 | -2.568 | -2.621 | -2.471 | -2.449 | -2.125 | -2.071 | -1.829 | -1.678 |
|
-N+P: Nitrogen starved in the presence of P-factor -N-P: Nitrogen starved in the absence of P-factor |