| 0 | 1 | 2 | 3 | 4 | 5 | 6 | 7 | 8 | |
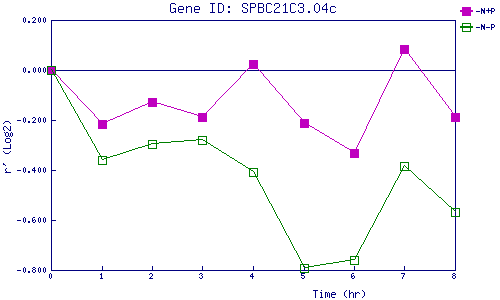
| -N+P | 0.000 | -0.216 | -0.128 | -0.187 | 0.025 | -0.211 | -0.333 | 0.083 | -0.187 |
| -N-P | 0.000 | -0.362 | -0.296 | -0.282 | -0.407 | -0.794 | -0.758 | -0.385 | -0.566 |
|
-N+P: Nitrogen starved in the presence of P-factor -N-P: Nitrogen starved in the absence of P-factor |