sap62
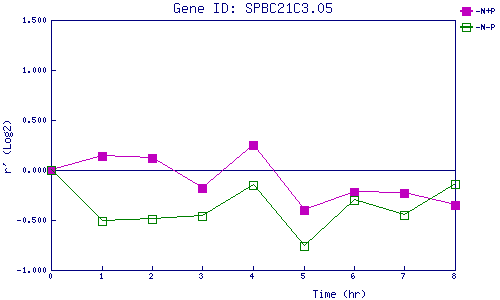
| 0 | 1 | 2 | 3 | 4 | 5 | 6 | 7 | 8 | |
| -N+P | 0.000 | 0.144 | 0.115 | -0.184 | 0.248 | -0.401 | -0.218 | -0.227 | -0.354 |
| -N-P | 0.000 | -0.512 | -0.490 | -0.461 | -0.152 | -0.762 | -0.301 | -0.453 | -0.145 |
|
-N+P: Nitrogen starved in the presence of P-factor -N-P: Nitrogen starved in the absence of P-factor |