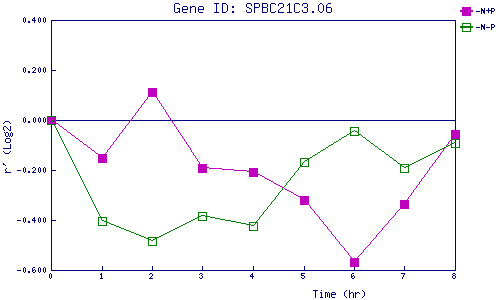
| 0 | 1 | 2 | 3 | 4 | 5 | 6 | 7 | 8 | |
| -N+P | 0.000 | -0.153 | 0.114 | -0.193 | -0.209 | -0.318 | -0.569 | -0.336 | -0.055 |
| -N-P | 0.000 | -0.405 | -0.483 | -0.384 | -0.424 | -0.170 | -0.044 | -0.190 | -0.093 |
|
-N+P: Nitrogen starved in the presence of P-factor -N-P: Nitrogen starved in the absence of P-factor |