| 0 | 1 | 2 | 3 | 4 | 5 | 6 | 7 | 8 | |
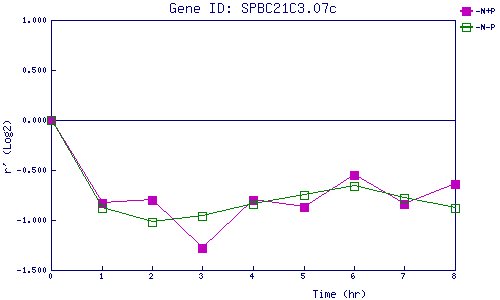
| -N+P | 0.000 | -0.831 | -0.802 | -1.281 | -0.797 | -0.871 | -0.551 | -0.843 | -0.635 |
| -N-P | 0.000 | -0.882 | -1.022 | -0.960 | -0.845 | -0.750 | -0.657 | -0.784 | -0.882 |
|
-N+P: Nitrogen starved in the presence of P-factor -N-P: Nitrogen starved in the absence of P-factor |