| 0 | 1 | 2 | 3 | 4 | 5 | 6 | 7 | 8 | |
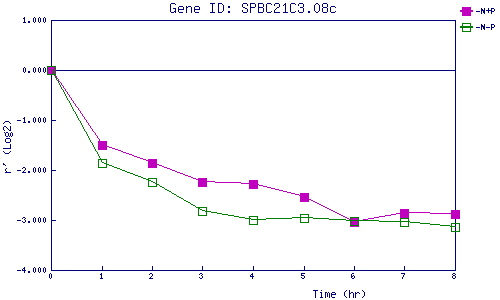
| -N+P | 0.000 | -1.506 | -1.852 | -2.238 | -2.277 | -2.531 | -3.040 | -2.851 | -2.887 |
| -N-P | 0.000 | -1.863 | -2.238 | -2.811 | -3.001 | -2.953 | -3.025 | -3.044 | -3.146 |
|
-N+P: Nitrogen starved in the presence of P-factor -N-P: Nitrogen starved in the absence of P-factor |