rps19-1 rps1901
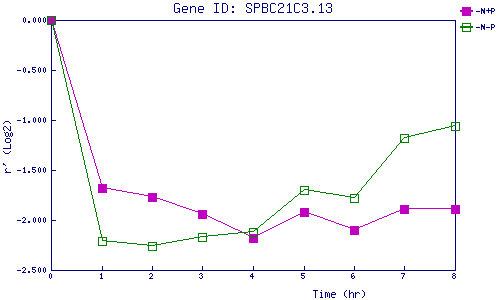
| 0 | 1 | 2 | 3 | 4 | 5 | 6 | 7 | 8 | |
| -N+P | 0.000 | -1.677 | -1.770 | -1.939 | -2.184 | -1.921 | -2.095 | -1.893 | -1.892 |
| -N-P | 0.000 | -2.209 | -2.259 | -2.170 | -2.115 | -1.700 | -1.783 | -1.183 | -1.060 |
|
-N+P: Nitrogen starved in the presence of P-factor -N-P: Nitrogen starved in the absence of P-factor |