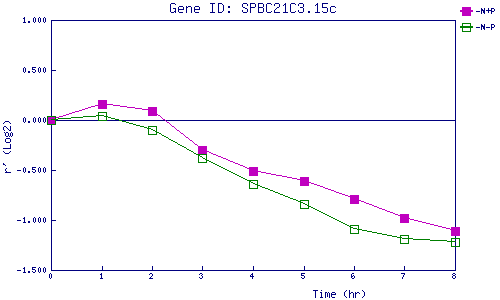
| 0 | 1 | 2 | 3 | 4 | 5 | 6 | 7 | 8 | |
| -N+P | 0.000 | 0.158 | 0.093 | -0.300 | -0.510 | -0.611 | -0.792 | -0.977 | -1.111 |
| -N-P | 0.000 | 0.035 | -0.101 | -0.378 | -0.640 | -0.835 | -1.094 | -1.192 | -1.225 |
|
-N+P: Nitrogen starved in the presence of P-factor -N-P: Nitrogen starved in the absence of P-factor |