spt4
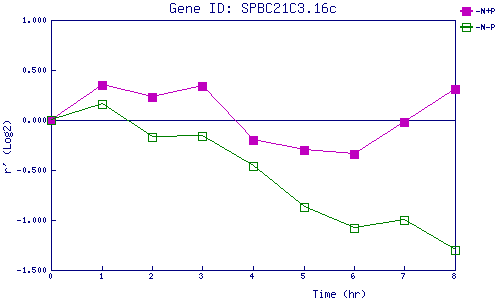
| 0 | 1 | 2 | 3 | 4 | 5 | 6 | 7 | 8 | |
| -N+P | 0.000 | 0.346 | 0.226 | 0.337 | -0.197 | -0.302 | -0.343 | -0.021 | 0.306 |
| -N-P | 0.000 | 0.159 | -0.167 | -0.160 | -0.464 | -0.866 | -1.081 | -0.997 | -1.304 |
|
-N+P: Nitrogen starved in the presence of P-factor -N-P: Nitrogen starved in the absence of P-factor |