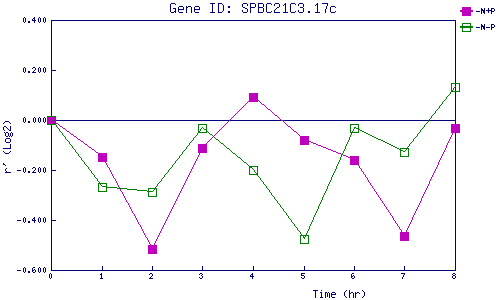
| 0 | 1 | 2 | 3 | 4 | 5 | 6 | 7 | 8 | |
| -N+P | 0.000 | -0.147 | -0.516 | -0.112 | 0.092 | -0.078 | -0.161 | -0.463 | -0.033 |
| -N-P | 0.000 | -0.269 | -0.286 | -0.033 | -0.200 | -0.475 | -0.030 | -0.126 | 0.133 |
|
-N+P: Nitrogen starved in the presence of P-factor -N-P: Nitrogen starved in the absence of P-factor |