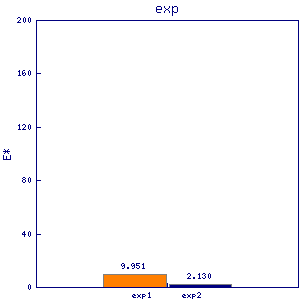
spo4
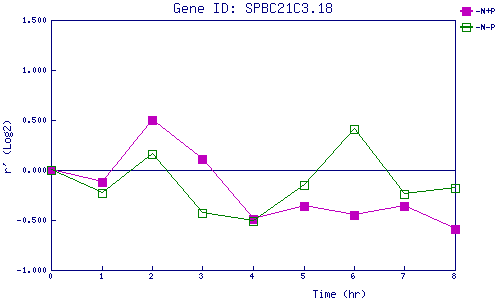
| 0 | 1 | 2 | 3 | 4 | 5 | 6 | 7 | 8 | |
| -N+P | 0.000 | -0.120 | 0.502 | 0.113 | -0.486 | -0.358 | -0.446 | -0.365 | -0.594 |
| -N-P | 0.000 | -0.228 | 0.157 | -0.430 | -0.506 | -0.152 | 0.407 | -0.242 | -0.175 |
|
-N+P: Nitrogen starved in the presence of P-factor -N-P: Nitrogen starved in the absence of P-factor |