ucp3 soc2
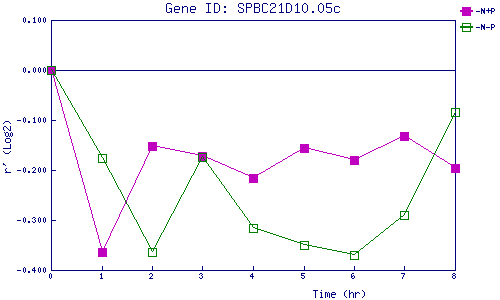
| 0 | 1 | 2 | 3 | 4 | 5 | 6 | 7 | 8 | |
| -N+P | 0.000 | -0.365 | -0.151 | -0.172 | -0.216 | -0.157 | -0.179 | -0.133 | -0.196 |
| -N-P | 0.000 | -0.176 | -0.365 | -0.174 | -0.316 | -0.350 | -0.370 | -0.290 | -0.084 |
|
-N+P: Nitrogen starved in the presence of P-factor -N-P: Nitrogen starved in the absence of P-factor |