| 0 | 1 | 2 | 3 | 4 | 5 | 6 | 7 | 8 | |
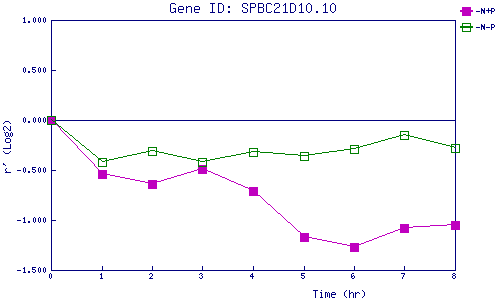
| -N+P | 0.000 | -0.537 | -0.642 | -0.490 | -0.706 | -1.167 | -1.271 | -1.085 | -1.050 |
| -N-P | 0.000 | -0.419 | -0.313 | -0.419 | -0.325 | -0.358 | -0.292 | -0.151 | -0.283 |
|
-N+P: Nitrogen starved in the presence of P-factor -N-P: Nitrogen starved in the absence of P-factor |